Sep 2025 – May 2026
TL;DR ⋆✴︎˚。⋆
Autonomous systems are beginning to govern domestic energy decisions; households can observe what systems do, but not why.
My dissertation addresses the epistemic gap by conducting a Research through Design study to investigate what interface designs best support a non-technical user’s ability to understand, trust and exercise appropriate agency over autonomous AI energy decisions.
Context
Solar energy apps such as ‘SolisCloud’ now ship with AI that automatically decides whether to store, use or sell your energy. Research shows that without an explanation, people can blame the energy company and consider switching the system off.
PRIMARY RESEARCH QUESTION
Given that an AI system is autonomously making domestic energy decisions, what interface designs best support a non-technical user’s ability to understand, trust, and exercise appropriate agency over those decisions?
Research
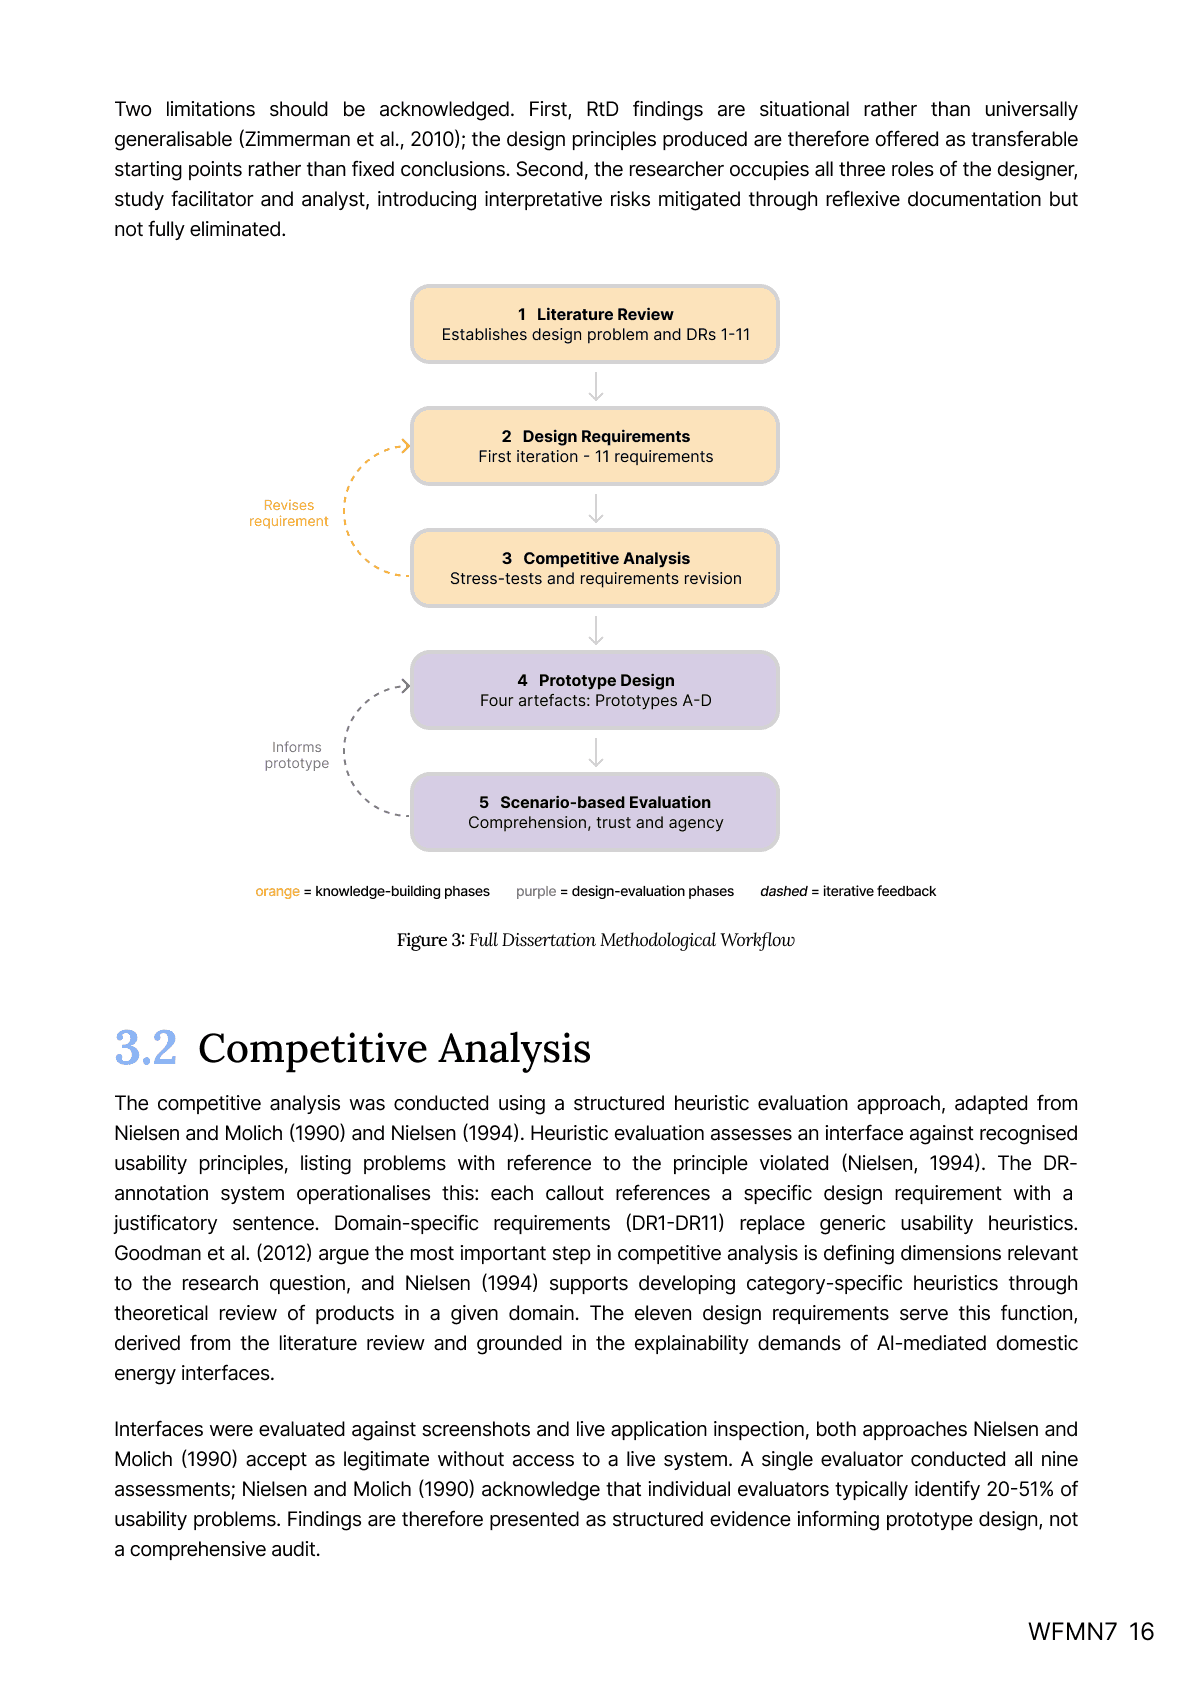
The research process consisted of two phases. The first phase was an extended literature review into the academic and industrial domains of HCI and domestic energy systems, time series data visualisation, and interpretability and AI legibility.
KEY INSIGHTS
The second phase of the research process consisted of a competitive analysis conducted using a structured heuristic evaluation approach. Nine interfaces were assessed against recognised usability principles. The first tier of analysis compared each interface to the pre-determined design requirements, with the second tier extracting positive design conventions from them.
Build
The build was comprised of four different prototypes, operating at successive levels of explainability (according to Doran et al. 2017). All designs were informed by findings gathered from the research phase.
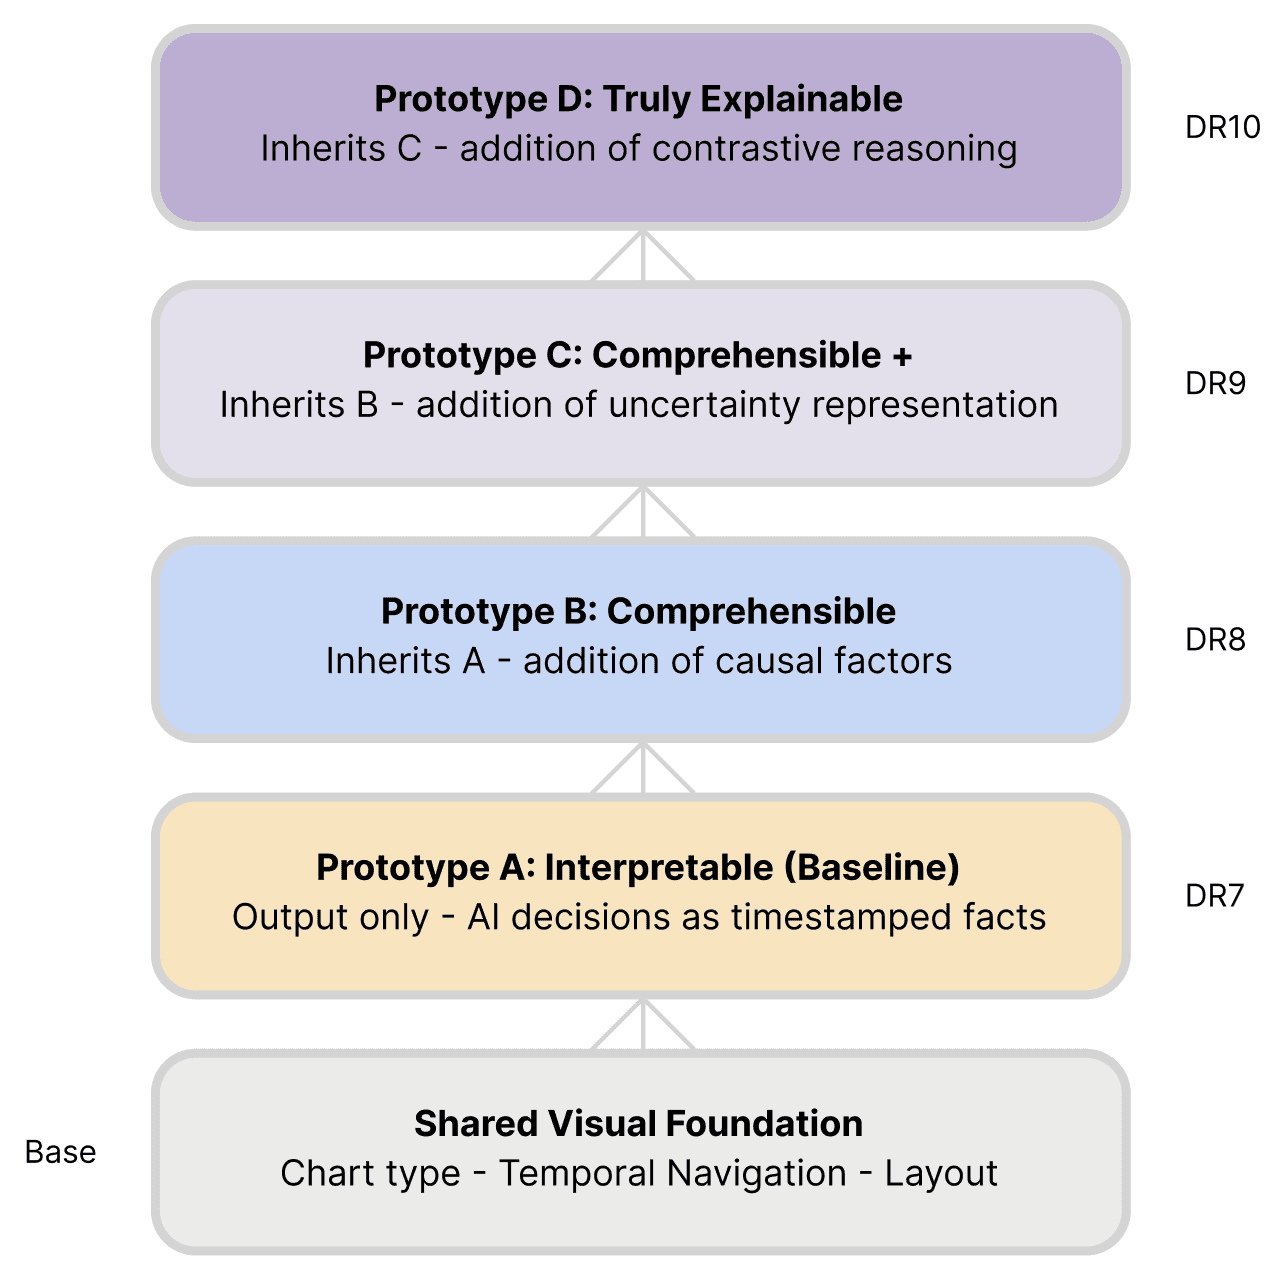
CUMULATIVE PROTOTYPE SPECTRUM
All prototypes draw from a shared foundation, visualised in the below low fidelity wireframe, allowing for the separation between structural and visual design questions. Prototypes A-D cumulatively inherit this foundation.

WIREFRAME
The carousel below shows the final iterations of all four prototypes. Scroll through to learn more about each prototype's design decisions.


Test
Twelve 60-minute remote sessions on Microsoft Teams were conducted with UCL Ethics approval. The test comprised of an overview (10 mins), briefing (5 mins), prototype interaction (35 mins) and interview (10 mins). To control for first-order effects, a cyclic Latin square design was utilised.
Live test website can be accessed here.

A think-aloud protocol was adopted in order to capture participant reasoning throughout the interactions. Once prototypes had been observed, a standardised comprehension probe was asked to elicit self-explanation.
Can you explain why the system made that decision?
Discovery
1. More explanation isn’t always better.
Of the 10 participants that engaged with the explanation, 6 of them named Prototype C as their sweet spot:
“1 was a lot, 2 was not enough… 4, I think, was probably a nice sweet spot.”
P4, where their Prototype 4 was C
“It made it better until 3, but then when it was full… I don’t know what’s going on now.”
P5 about Prototype D
2. Showing carbon isn’t the same as caring about it.
When D spelled out the carbon trade-off, people could reason with it:
“Charging at 8 costs virtually the same, minus 8p, but produces 1.6g more CO₂… The AI prioritised carbon reduction.”
P6
But 6 out of 12 participants left carbon out of their summaries entirely when explaining the AI's reasoning. Some opted out as they weren't personally 'eco-conscious', and the amount meant little too: 'Two kilograms… what, in my life?" Surfacing carbon is necessary, but it is not enough.
3. People want five different types of control.
Add supporting description for this discovery here.
Collaborative
P1
I feel like I'm part of the decision making
Trust from ownership
P3
I do generally trust these. That's why I've got all this stuff
Full delegation
P4, P11
I'm too lazy to look at all the price differences
Ask me first
P5, P6, P8
Make it ask me if it wants to reschedule something
Set my priorities (new)
P2, P12
Have an option to say I want to prioritise purely price... or the most green way
4. Explanations can feel like a sales pitch.
10 of the 12 participants sensed that the system was attempting to look trustworthy without earning it, but in different ways for each prototype.
“They're just throwing the information there and then I just have to trust it.”
P11 about Prototype A
“Why is it high confidence? What is it based off on... There's no sort of evidence backing that up.”
P9 about Prototype C
“It was saying this solution is better than this other random scenario. I don't know if it was that convincing.”
P12 about Prototype D
5. Same design, different trust
The same confidence display worked in different ways. P1 used it to calibrate (“I trusted the decisions when the accuracy percentage was higher”). P6 trusted it more for “admitting if it was moderate or low confidence”. P5 rejected it: “How would you know how accurate the forecast is if it hasn’t happened yet?” Trust and control came as a pair, so explanations need to match both.
Reflections ⋆˙⟡
Design for a target user, not just an average. Identical screens produced divergent trust and control needs. Interfaces should offer explanation modes, but not necessarily always at a fixed depth.
How information is discovered is more important than how much is said. Information architecture, visual hierarchy and visible affordances mattered more than raw explanation detail.
Honest uncertainty needs a source. Confidence earns trust only when you show where it comes from.
Building taught me as much as testing. It was important to cut out anything that implied a power the AI system didn't actually have.
If you are interested in this project, feel free to read the full paper here! 𐙚⋆.˚
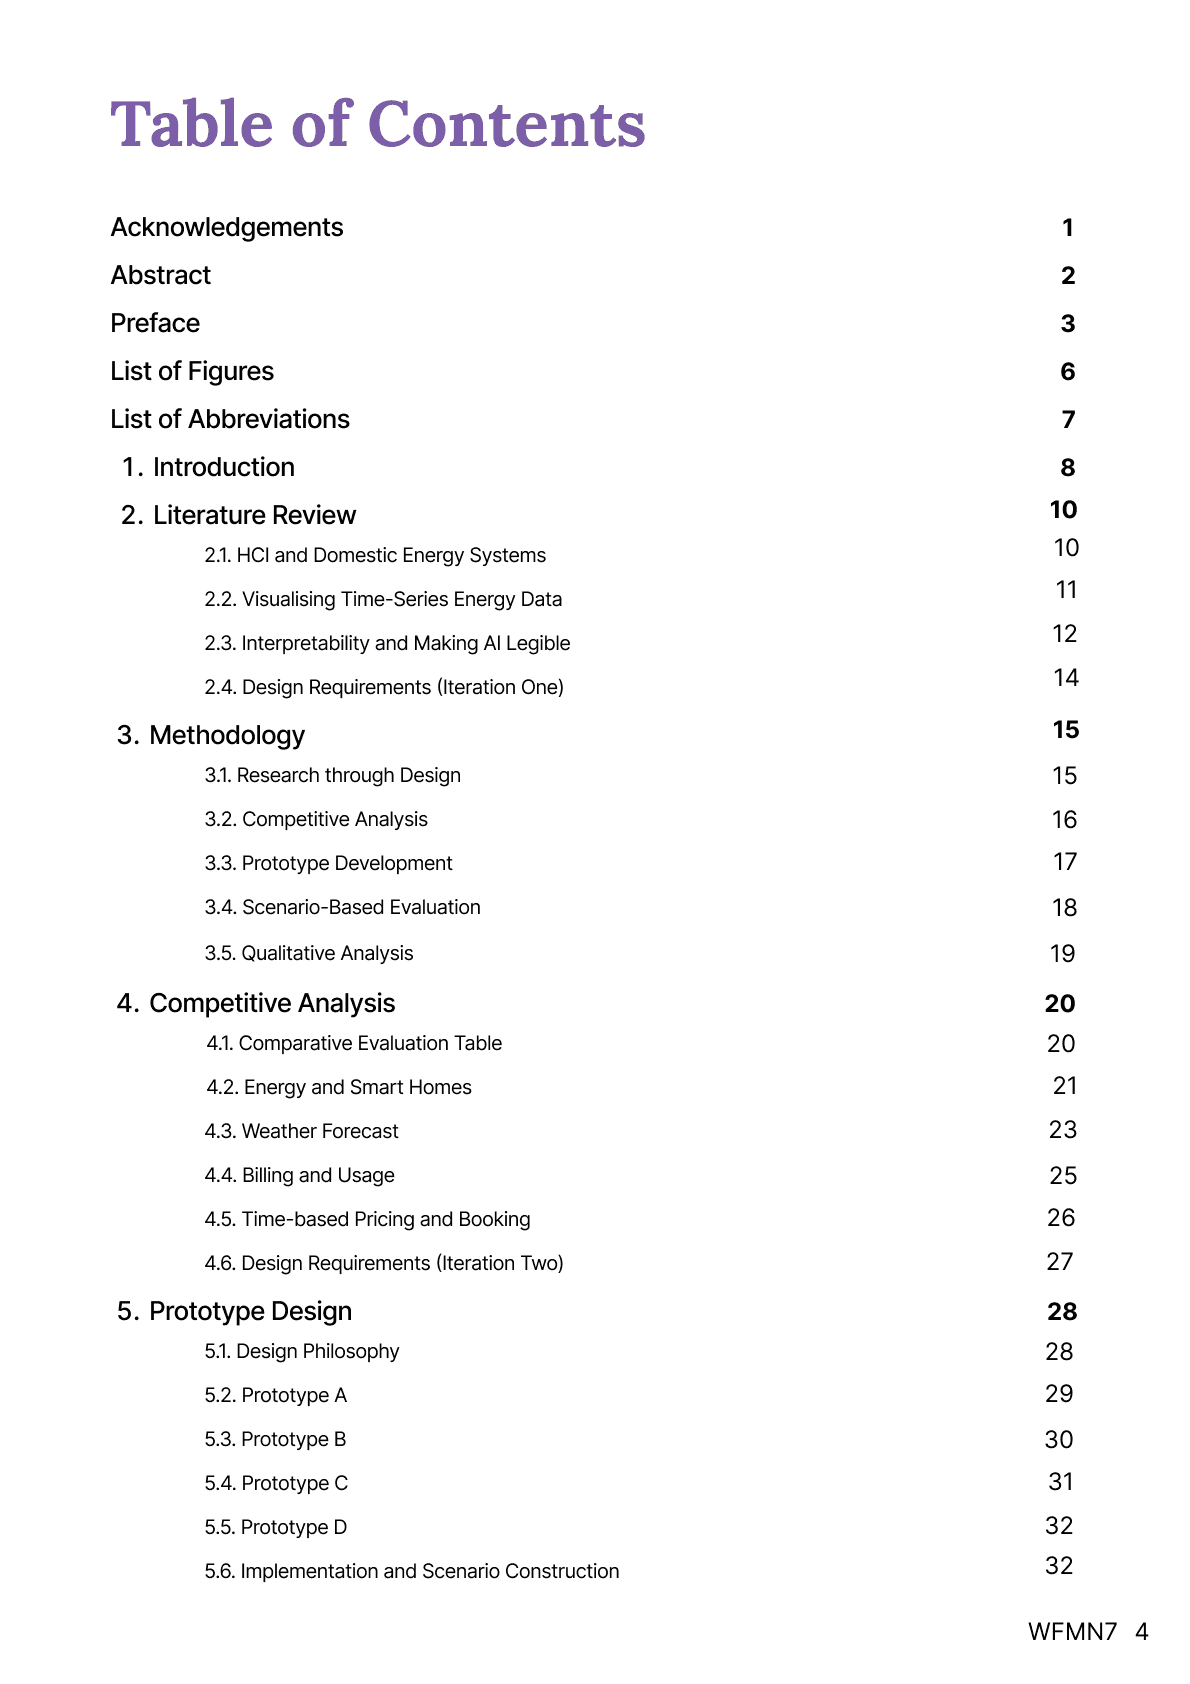
Full Dissertation Paper






this website was made by nyree marsh >_<

Prototype A

Prototype B

Prototype C